
Default landscape: Feuerthalen
The forest, climate and management scenarios that ForestStudio Edu runs on
The Feuerthalen forest
We use the public forest of Feuerthalen (Canton of Zurich, Switzerland) as a case study to demonstrate the capabilities of ForestStudio Edu for landscape-level forest management planning. This same landscape is also applied in the Landscape-Level Forest Management course at ETH Zurich.
The Feuerthalen forest covers approximately 280 hectares and features a diverse mix of tree species. Conifers such as Norway spruce, silver fir, larch, and Scots pine coexist with broadleaved species including European beech, oak, ash, sycamore maple, and wild cherry, among others.
Forest area distribution:
Productive forest area
97.59 ha
Non-productive stocked area
0.13 ha
Private forest
7.7 ha
Public forest
97.7 ha


Figure 1. Overview of the management divisions used in Feuerthalen during the 2014-24 period and the new division.
The forest at the start
Every simulation of Feuerthalen starts from the same forest: a list of 68,453 individual trees, each with its species, diameter, age, and the hexagonal cell and management unit it stands in. This is the population that then grows, dies and regenerates in the model (see Forest demography).
Trees
68,453
Tree species
8
Management units with trees
150
Hexagonal cells with trees
13,097
Which species?
Feuerthalen starts as a broadleaf-dominated forest. European beech is the most common species with 46% of the trees, followed by European ash (29%) and Norway spruce (14%). Counting trees and measuring basal area do not give the same picture: a species with few but large trees weighs more in basal area than in numbers. Pedunculate oak, for example, is 5% of the trees but 9% of the basal area.
How big and how old?
Most trees are small and young: 58% have a diameter below 20 cm and 47% are in the youngest age class. A much smaller number of large, old trees, up to 55.1 cm in diameter and 130 years old, holds a large part of the standing wood.

The initial trees take only 38 different diameters and 11 age classes. Within a management unit, the trees of a species mostly start with the same diameter and age, so the starting forest is more uniform than a real one. Differences between individual trees build up as the simulation runs.
Vitality in 2024
You can consult the vitality map from 2024 here.
Climate scenarios
Forests grow slowly, so a management decision taken today plays out in a climate that will not be today’s. In ForestStudio the climate is an input: for every simulated year the model reads twelve monthly mean temperatures and twelve monthly precipitation sums for Feuerthalen (climate station at 438 m a.s.l.). You can run the same management scenario under different climates and compare the outcome.
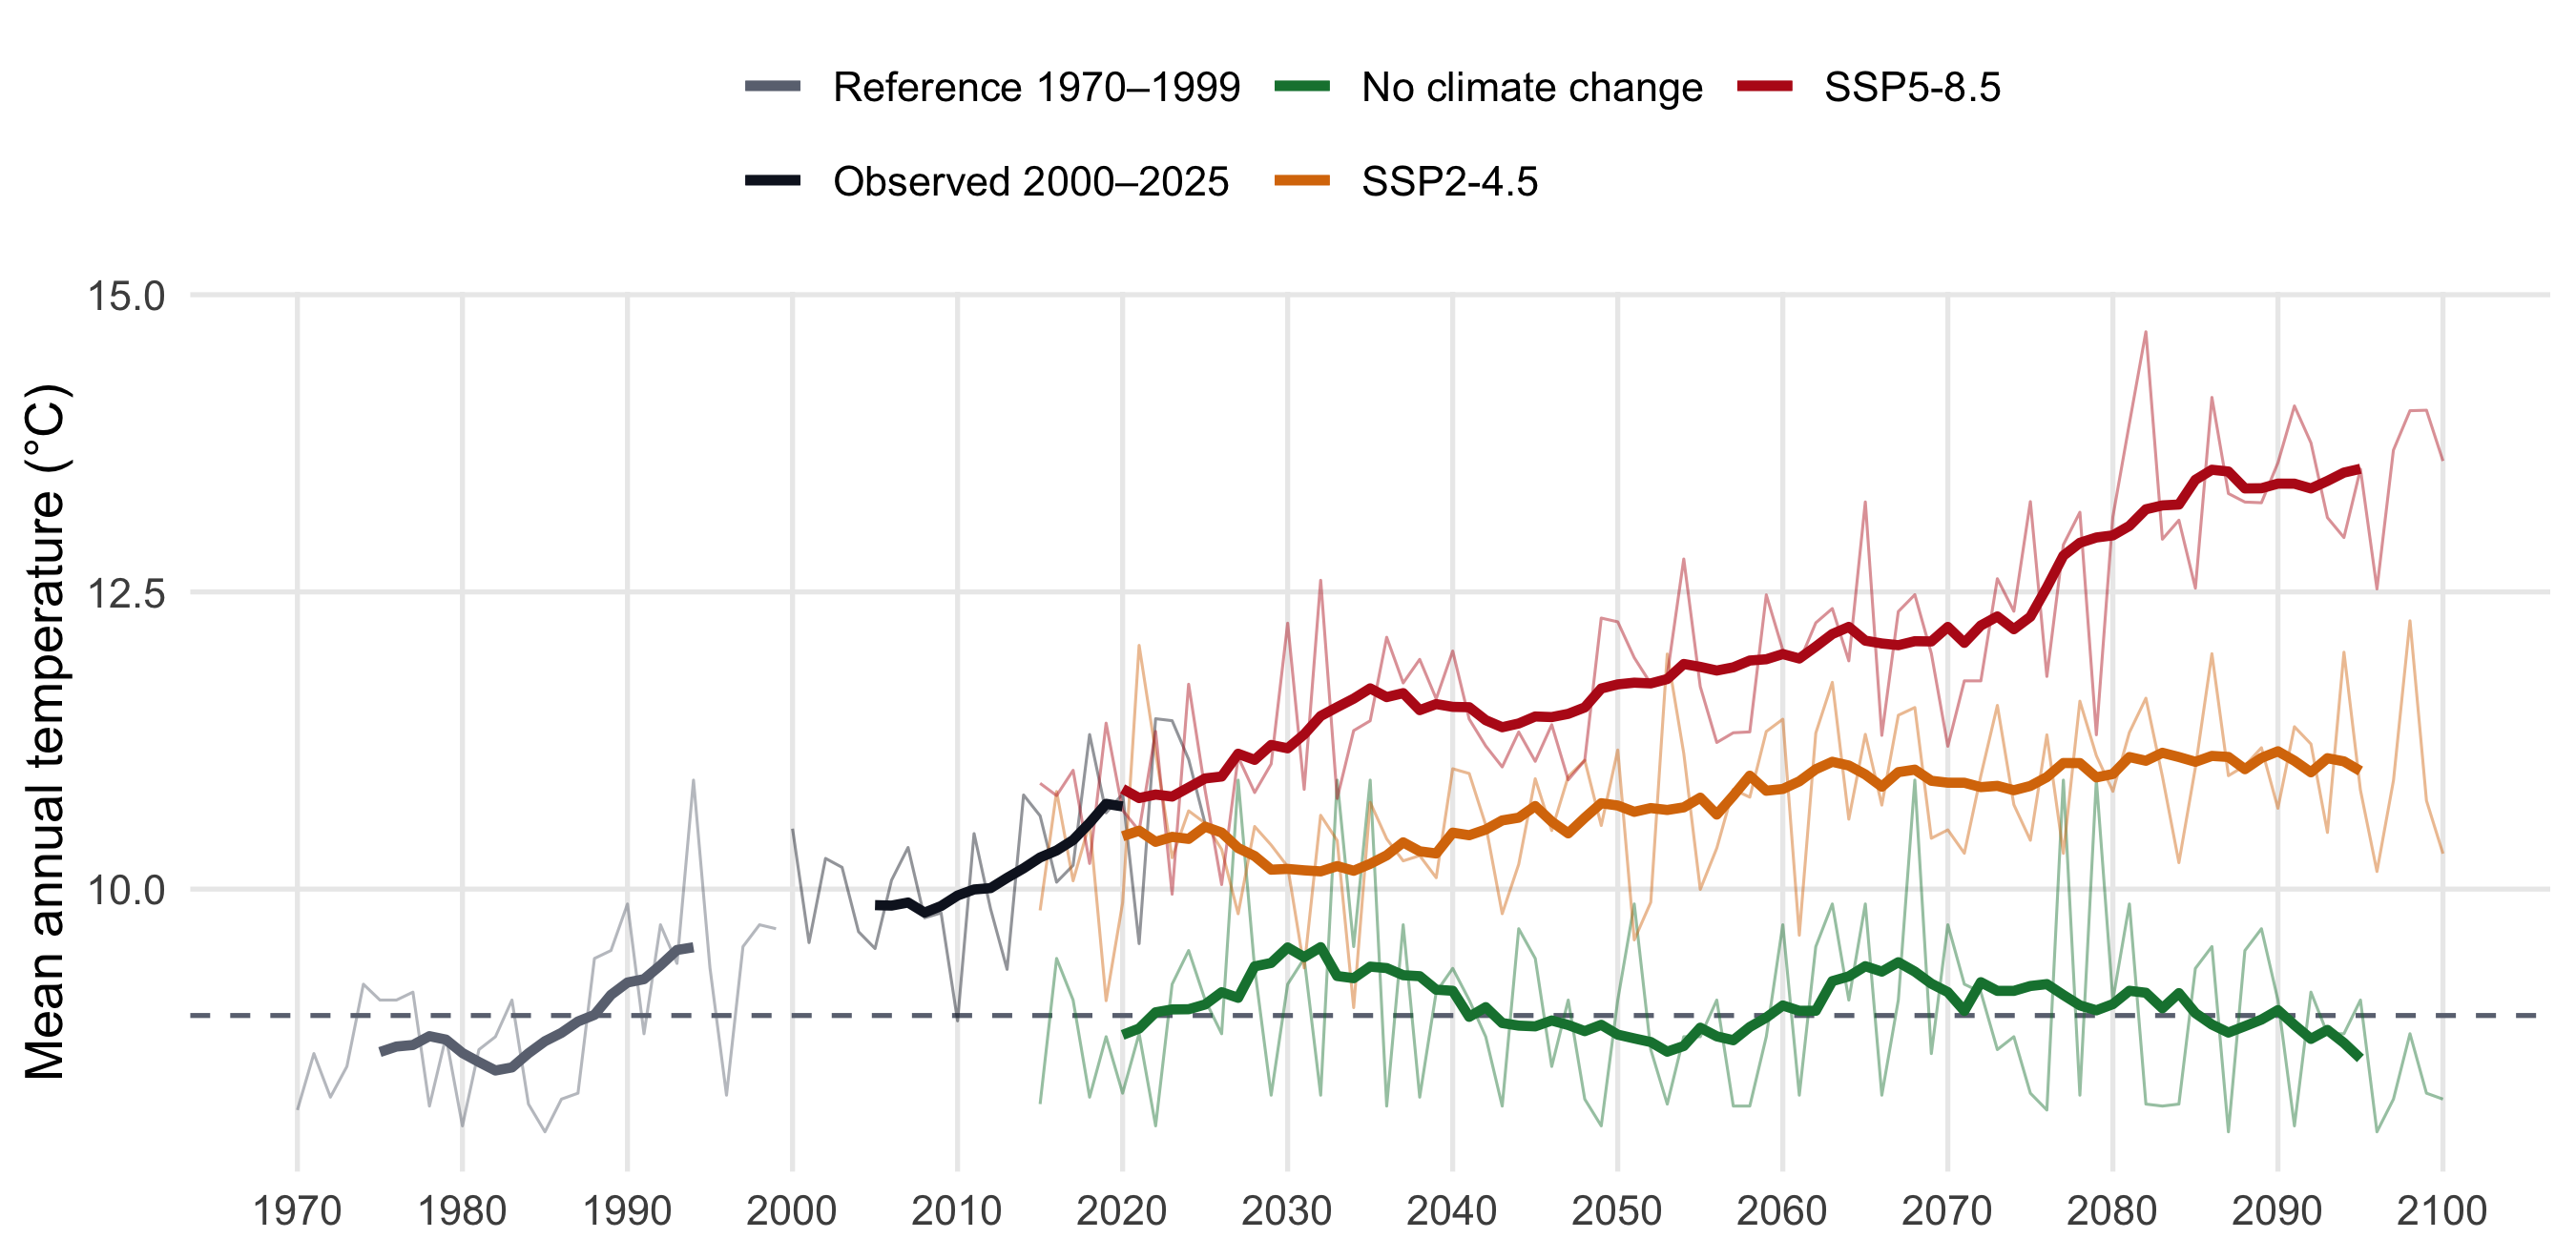
Five climate series are available for the case study, the data was obtained from the CMIP6 general circulation model MRI-ESM2–0 under two Shared Socioeconomic Pathways (SSPs): SSP2–4.5, representing a moderate climate change trajectory, and SSP5–8.5, reflecting a more severe scenario:
Past
Reference 1970–1999
The climate the forest grew up in. It is the baseline that all changes on this page are measured against.
Past
Observed 2000–2025
The most recent years, already warmer than the reference period.
Future
No climate change
2015–2115. A future that keeps the climate of the reference period, built by repeating years of that kind in a new order.
Future
SSP2-4.5
2015–2115. A middle-of-the-road emissions pathway with moderate warming.
Future
SSP5-8.5
2015–2115. A high-emissions pathway with strong warming.
Temperature
During the reference period the mean annual temperature in Feuerthalen was 8.9 °C. The years 2000–2025 were already 1.3 °C warmer. By the last three decades of the century (2071–2100) the scenarios sit at −0.1 °C (no climate change), +2.1 °C (SSP2-4.5) and +4.2 °C (SSP5-8.5) relative to the reference.
Precipitation
Precipitation tells a different story. The annual total was about 910 mm in the reference period, and the scenarios do not agree on a direction: for 2071–2100 the annual total is 900 mm without climate change, 1000 mm under SSP2-4.5 and 890 mm under SSP5-8.5. What stands out is the variation from one year to the next, which is larger than the differences between scenarios.

The shape of the year
For trees, when it is warm and wet matters as much as the annual figure. The next plot compares the average year of the reference period with the average year at the end of the century.

Management scenario BAU
We defined a BAU (Business-As-Usual) management scenario for the Feuerthalen case study based on the 2014–2024 forest management plan information.
The management follows a continuous cover forestry approach (no clear cuts are applied), with thinning from above as the primary intervention type.
It is applied at the management unit (MU) level, with different strategies depending on dominant species and management objectives.
This section describes the criteria used for the BAU management scenario following the management strategies implemented in ForestStudio.
The management plan defines spatial units as stands.
In this BAU scenario, each stand is considered a Management Unit (MU), applying consistent management strategies according to the MU’s land-use type or, where no explicit function was defined, its dominant species.
Dominant Tree Species Classification
Dominant species were defined in each MU based on the proportion of basal area, with a species considered dominant if it represented ≥70% of the total basal area.
When no dominant species was present, the MU was classified according to its mixture type, distinguishing among:
- Conifer mix stands
- Broadleaf mix stands
- Mixed conifer–broadleaf stands
Management Units considered
We excluded from the simulation all MUs designated as non-forest land uses.
In the BAU scenario, MU 1002 was assumed to have no management, as it is assigned as a forest reserve in the management plan (though it was still included in the simulation).
Meadow areas were assumed to remain unchanged and were excluded from the simulations (MUs 106, 601, 616, 618, and 905).
The Christmas tree farm (MU 620) was also excluded. Consequently, revenues from this activity are not considered, though they could be included after simulation.
We also assumed that the field_stream_wood land type (MUs 904 and 1001) represents narrow riparian strips or wooded stream margins, maintained primarily for erosion control, habitat conservation, or hydrological protection rather than for timber production.
Inventory data indicate no trees present in these MUs, and they were therefore excluded from the BAU scenario.
| MU Code | Description | Notes |
|---|---|---|
| 106 | 47_field_meadow_pasture_humus | – |
| 311 | permanently_open_area | Possibly landslide damage |
| 501 | 37_storage_area | – |
| 601 | 47_field_meadow_pasture_humus | – |
| 616 | 47_field_meadow_pasture_humus | – |
| 618 | 47_field_meadow_pasture_humus | – |
| 620 | 20_christmas_tree_farm | Revenue not considered |
| 904 | 40_field_stream_wood | – |
| 905 | 47_field_meadow_pasture_humus | – |
| 1001 | 40_field_stream_wood | – |
Management Strategies considered in BAU scenario
We defined seven management strategies, assigned to different MUs based on their dominant species (as defined in Section 6) and land-use type.
Target diameters were defined species-specifically according to management recommendations.
For Norway spruce (Picea abies), to reduce bark beetle risk, a lower target diameter of 35 cm (instead of 40 cm) was adopted.
The management plan recommends increasing firewood production, implying reduced target diameters or higher harvest probability in smaller diameter classes.
However, this BAU scenario does not include such adjustments.
The plan also mentions common walnut (Juglans regia), but since the inventory data provide no spatial information and the species is not yet parameterized in ForestStudio, it was excluded from this analysis.
BAU parameters applied to all MUs
The same thinning curve, MU constraints and species rules are used in every managed MU.
Thinning curve (MU level). Thinning from above with \(a = -5\) and \(b = 0.1\): the probability of removal rises with tree diameter and reaches 50% at 50 cm DBH.
MU constraints.
| Parameter | BAU value |
|---|---|
Target basal area (target_basal_area) |
30 m²/ha |
Minimum basal area (minimum_basal_area) |
15 m²/ha |
Maximum harvest basal area (max_harvest_ba) |
25 m²/ha |
Harvest intensity (harvest_intensity_min – harvest_intensity_max) |
0 – 1 (no limit) |
Species rules.
| Species | Large wood share | Large wood diameter | Target diameter |
|---|---|---|---|
| Silver fir (aalb) | 0.10 | 50 cm | 45 cm |
| Sycamore maple (apse) | – | 50 cm | 60 cm |
| Ash (fexc) | – | 50 cm | 60 cm |
| Beech (fsyl) | 0.10 | 50 cm | 60 cm |
| Larch (ldec) | 0.10 | 50 cm | 60 cm1 |
| Norway spruce (pabi) | 0.40 | 50 cm | – |
| Scots pine (psyl) | 0.15 | 50 cm | 55 cm1 |
| Pedunculate oak (qrob) | 0.20 | 50 cm | 70 cm |
Large wood share: minimum share of the MU’s basal area held by large trees of the species; while the share is below it, those trees are protected (removal probability 0). Large wood diameter: the DBH from which a tree counts as large wood. Target diameter: trees at or above it get removal probability 1. 1 45 cm for sawlog production, to discuss.
How these parameters act on each tree is explained on the Management page.
Aggregated MUs (NMU)
In addition to the original MUs, the landscape can be summarised in five larger areas (NMUs), each grouping several MUs. This is only an aggregation for analysing and reporting results: it does not change management. Management scenarios are still defined per original MU, and NMUs cannot be used in a management scenario.
| NMU | Description | MUs included | Main function |
|---|---|---|---|
| 2001 | Northern Area | 502, 503, 504, 505, 506, 507, 508, 509, 510, 511, 512, 513, 514, 515, 516, 517, 518, 519, 520, 602, 603, 604, 605, 606, 607, 608, 609, 610, 611, 612, 613, 614, 615, 617, 619, 620, 621, 622, 1002 | Productive |
| 2002 | Central Area | 401, 402, 403, 404, 405, 406, 407, 408, 409, 410, 411, 412, 413, 414, 415, 416, 417, 418 | Reservoir protection |
| 2003 | East Area | 101, 102, 103, 104, 105, 107, 108, 109, 110, 111, 112, 113, 201, 202, 203, 204, 205, 206, 207, 208, 209, 210, 211, 212, 213, 214, 215, 216, 217 | Productive |
| 2004 | South-Area | 301, 302, 303, 304, 305, 306, 307, 308, 309, 310, 311, 312, 313, 714, 715, 716, 717, 718, 719, 720, 801, 802, 803, 804, 805, 806, 807, 808, 809, 810, 811, 812, 813, 814, 815, 816, 817, 818, 819 | Productive |
| 2005 | Central south area | 701, 702, 703, 704, 705, 706, 707, 708, 709, 710, 711, 712, 901, 902, 903, 906, 907, 908, 909, 910, 911, 912, 913, 914, 915, 916 | Productive |
How harvested wood is valued, from assortments and quality classes to price matrices and harvesting costs, is explained on the Economic assessment page.